Chemical Analysis of Ceramic Matrix Composites

Ceramic matrix composites (CMCs) are the next generation of aerospace materials. Similar to practically any material used by the aerospace industry, controlling the purity of “aerospace grade” composites is going to be indispensable to achieve the desirable mechanical properties, reliability and lifetime. 

On the analytical side, CMCs present multiple challenges for conventional chemical analysis techniques. The extreme chemical inertness of CMCs toward common digestion media, for instance, makes the use of solution-based chemical analysis techniques for purity control exceedingly challenging. 

Although direct solid sampling techniques can eliminate the necessity of sample digestion, the complex nature of ceramic matrix composites could still cause large measurement uncertainties.

Fast-flow glow discharge mass spectrometry (FF-GDMS) is a direct solid sampling analytical technique designed for high sensitivity, full survey elemental analysis of solids. Operating the fast-flow source in pulse modes permits better control of the atomization of complex samples enabling mass fraction distribution of elements to be monitored in favorably adjustable volume fractions. 

In this study, we demonstrate that this technique is exceptionally robust and one of the most sensitive analytical tools currently available for full survey chemical analyses as well as depth specific distribution analysis of CMC materials. 

Figure 1: Schematic illustration of the fast flow high power source, the standard GD source deployed on the FF-GDMS instruments.
Figure 1: Schematic illustration of the fast flow high power source, the standard GD source deployed on the FF-GDMS instruments

Due to the complexity of CMC samples from plasma sputtering point of view, in addition to FF-GDMS measurements, we also investigated complementary characterization techniques, such as direct insertion probe mass spectrometry (DIP-MS), inert gas fusion – infrared/thermal conductivity analysis (IGA), and high resolution thermogravimetric analysis (HR-TGA), for evaluation and/or verification of gas forming elements present in CMC samples.

INTRODUCTION

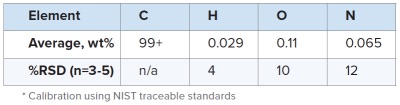
CMCs adopt the common reinforcement/matrix architecture. The inherent anisotropy in structure calls for controlling not only the bulk level of impurities but also their distributions. Low atomic mass elements such as B, C, N, O, Al and Si present in CMCs could outgas fairly easily during the manufacturing processes and during their service phases as compared to traditional alloys, resulting in internal voids, erosion and even corrosion of components. Hence, it is envisioned that chemical impurities and distribution, as well as outgassing, must be thoroughly understood and controlled to realize the full potential of CMC materials.

CMCs present unique challenges to conventional chemical analysis techniques. They show chemical inertness toward even the most aggressive digestion media, rendering wet chemistry-based analysis techniques ineffective, let alone not appealing due to loss of spatial distribution information.2 In that sense, direct solid sampling techniques, which eliminate the need of sample digestion altogether and have the ability to provide depth-specific distribution information, are gaining attraction. However, the complex nature of CMCs could lead to large measurement uncertainties, especially for those direct solid sampling techniques which require matrix-matched calibration standards.

Thermo Scientific introduced fast-flow glow discharge mass spectrometry technique, in their Element GD model, in 2005. This instrument combines a fast flow direct current GD (Glow Discharge) source with a sector field mass analyzer. One of the main features of the Element GD is that it has very efficient direct solid sampling capability, fast data acquisition, and very high mass resolution (up to 10,000). 

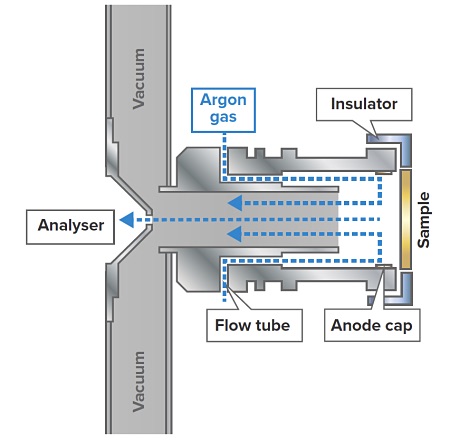
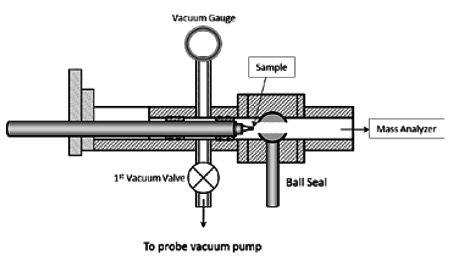
Figure 1 illustrates the schematic of the fast flow GD source. In this configuration, a discharge gas flow, typically argon, is directed toward the sample surface via a vertically aligned replaceable flow tube. At discharge gas flow rates of few hundreds of sccm/min, the sample surface sputters at very high atomization rates (μm/min) setting the prerequisites for very sensitive mass fraction determinations.3 The presently investigated GD source differs from those employed in VG9000 and Astrum GDMS models. The fast flowing gas generates a jet stream that moves in the direction of the plasma region from the cathode surface. This jet stream-assisted transport of the sputtered atoms, among other effects, noticeably makes sputtering more uniform for samples having internal voids, cavities or rough surfaces, such as composites. This enhancement becomes even more pronounced when the FF-GD source voltage is modulated.4

Previously, we have demonstrated FF-GDMS as a very effective tool in assessing the trace impurities in isotropic nuclear grade graphite.5 In this study, FF-GDMS was evaluated for its applicability for chemical analysis of carbon fiber–reinforced carbon composites (CFRCs). Our findings demonstrate the advantages of this method for analysis of composite samples with complex architectures, especially when the source is operated in modulated mode. Our approach is very effective for full survey chemical analysis of composites, providing sensitivities down to ultra-trace levels practically for all elements in the periodic table. The technique has also shown to be extremely robust, making it ideal for daily quality or process control of a broad range of materials that are presently actively sought for advanced applications. In addition to full survey analysis of CFRC samples by FF-GDMS, we have examined the release characteristics of gas-forming elements in CFRCs. Outgassing analysis, important in its own right as a quality gauge to CFRC, also helps to validate GDMS measurements, given that outgassing molecular species in the plasma can affect the atomization and ionization processes. Hence, multiple complementary analytical approaches were studied for evaluations of gas forming elements in CFRCs.

EXPERIMENTATION

GDMS Sample Preparation

Figure 2 shows the Scanning Electron Microscopy (SEM) images of a CFRC sample (grade PC70: chopped fiber, reinforcement pattern 12K Twill). Typical of fiber-reinforced composites, it is characterized with surface roughness, and cavities formed by the fiber pattern, and with micro particle impurities dispersed therein. This is not a flat sample geometry that is typically analyzed by FF-GDMS. In this study, a square size testing specimen (20 mm × 20 mm × 1 mm) was cut out from a large CFRC plate and directly mounted onto the GD Source. No further surface pre-treatment was performed. For bulk impurity measurement, potential surface contaminants were pre-sputtered before equilibrated readings were acquired through a representative sampling volume for statistical evaluation.

Figure 2: SEM images on carbon fiber-reinforced carbon composite material, grade PC70 (Schunk Carbon Technology), in COMPO mode (mostly z-contrast). The bright spots (shown circled above) are micron size surface impurities having densities higher than that of carbon.

Method Development

The optimum nominal discharge gas settings, isotopes and measurement modes were investigated to adjust for sensitivities and atomization rates. 

Figure 3 highlights the impact of argon gas flow rate on plasma ignition and the subsequent atomization rate (ic – carbon ion current in Ampere). In the DC mode, plasma is barely ignited (ic ≈ 0 A) below 400 sccm/min argon flow; in comparison, glow discharge is readily established at similar flow rate when operated in the pulse mode, with ic ≈ 6E-11A. Further, the pulsed operation is shown to significantly increase the carbon ion intensity throughout the entire used gas flow rate range (400 – 540 sccm/min). At a flow rate of ≈ 455 sccm/min, for example, ic increases from 2.5E-11 A to 1.15E-10 A, a nearly five-fold increase. The argon background signal remains fairly constant in the pulse mode; whereas, in the DC mode, the argon signal increases with increasing argon flow rates. Thus, it is apparent that the pulse-mode operation can significantly improve the signal intensity/noise ratio, leading to more sensitive detection of trace and ultratrace elements.

Figure 3: Effect of nominal discharge gas flow rates on carbon ion intensity and argon background in both direct current (DC) and pulsed (2 kHz, 50 μs) modes.

Generally, medium resolution mode appears to be adequate for routine survey measurements of CFRC composites. Figure 4 illustrates, as an example, how isobaric interferences can be resolved from analyte peaks of Ti and Fe, respectively, in a medium mass resolution mode.

Figure 4: Medium resolution scan (R=4000) of 48Ti+ and 56Fe+ trace elements. Polyatomic interferences from 36Ar12C+ and 40Ar16O+ are well resolved.

One important aspect in method development is to evaluate the mass fraction equilibration time. This was accomplished by monitoring mass fraction development over sputtering time. In this investigation, the carbon matrix signal reached stable readings in a matter of several minutes after initiating data acquisition. However, operating in the DC mode, it takes at least 30 minutes of plasma sputtering time for some analytes to reach equilibrium state. Local turbulent flow created by the uneven sample surface and the presence of particulates on the surface and within interior voids, is suspected to be largely responsible for the longer equilibration time.

However, the equilibration time can be substantially shortened in the pulse mode. Figure 5 illustrates the temporal profiles of some commonly encountered trace impurities in CFRCs. The concentration ranges from ng/g to mg/g levels. Most elements were found leveling off within 10 min of sputtering. It is reasoned that during the DC operation, the back pressure created by continuous incoming argon flux from the plasma toward the sample localizes impurity atoms present within partially exposed voids or apertures. In the pulsed operation, such back pressure disappears during the pulse off period, creating a pressure wave which effectively sweeps impurities out of voids and cavities before next pulse arrives.

Instrumental Settings

Since pulsed modes provided significantly higher matrix ion signal intensities and need shorter equilibration times, all survey measurements in this study were conducted using the following instrumental parameters:

  • Operation mode: voltage modulated at pulse frequency 2 kHz, pulse on 50 μs and off 450 μs in each duty cycle
  • Discharge current: 5.5 mA
  • Discharge voltage: 1120 v
  • Discharge gas: 440 sccm/min Ar
  • Matrix signal intensity: ≈ E10 cps (Medium Resolution)
  • Consumables: graphite anode cap diameter Φ ≈ 8 mm; flow tube length L ≈ 20 mm
Figure 5: Trace impurity concentration profiles vs sputtering time for some common impurity elements found in CFRCs by pulsed GD acquisition. Average sputtering speed is ≈ 0.1 μm/min for carbonaceous materials. Concentration of most impuri-ties levels off within ≈ 10 min of sputtering, corresponding to an estimated sampling depth of ≈ 1 μm.

RESULTS

Table 1: Equilibrated mass fraction results of elements, which were found to be present in PC70 above the method determination limits.

Bulk chemical survey analysis

All results presented here were measured as ion beam ratios and adjusted to mass fraction results by applying element specific sensitivity factors from the instrument’s Standard RSF table (Table 1). This is quite often a common practice for initial quantification of experimental results or for analyses without certified reference materials. With this generalized approach the nominal results are typically within a factor or two of accepted values.

Sensitivity

Typically the detection limit values achieved are at ultra-trace levels, and are limited only by the signal to noise ratio of approximately few counts per second (cps) vs. 1E10 cps (background noise versus Carbon signal integrated intensity). Elements that yield higher detection limit values are either due to lower isotopic abundances of the isotopes, such as 44Ca, 82Se, or are in the vicinity of the suitable isotopes where the background noise is higher due to the presence of interfering isobaric peak signals.

Outgassing assessment of CFRCs

Outgassing from sample destabilizes the plasma during GDMS analysis. Substantial outgassing can make the sample analysis impossible to accomplish. Furthermore, outgassing of CFRCs is an important issue that needs to be dealt with from materials engineering point of view, whether in processing or during the service period. In this study, outgassing of CFRCs was investigated over a broad range of temperature and pressure regimes.

Thermogravimetric analysis measures the mass loss as a function of temperature and time, providing sensitive measurement of outgassing rate and total outgassing levels. Figure 6 shows the TGA profile of CFRCs in inert atmosphere from room temperature to 1000ºC. Using a sample mass of ≈100 mg, one can detect 100 μg/g (i.e. 0.01%) mass loss with this approach. In this case, the sample exhibits two-stage mass loss, at 800 μg/g and 200 μg/g by 500ºC and 1000 ºC respectively.

Figure 6: High resolution TGA evaluation of trace outgassing of C/C composite. Total outgassing amount was determined for each temperature stage.
Figure 7: Schematic diagram of DIP-MS sampling configuration.

One of the major challenges in outgassing analysis is loss of analytes from the source to the detector, in particular when less volatile or highly reactive outgassing species are formed. Incorporating a heated transfer line is a solution exhibiting limited success. Here we propose a vacuum outgassing analysis technique DIP-MS. 

Figure 7 illustrates the sample introduction component of DIP-MS. A quartz sample vial is mounted on the tip of a temperature programmed probe, and is directly exposed to the high vacuum environment (≈ 10-7 torr) of the mass analyzer source. Equipped with this sample introduction system and a quadrupole mass analyzer capable of scanning masses of up to 1000 amu, DIP-MS is extremely effective in survey analysis of outgassing molecular species, including those with high reactivity or low volatility. In a DIP-MS analysis, typically a small amount of sample (1 ≈ 10 mg) is evaluated. 

Figure 8 illustrates the identified main outgassing species and their temperature/time-dependent releasing profiles, including CO2, C2F4, SO2, hydrocarbons and fluorocarbons. These results clearly demonstrate that DIP-MS is a very powerful tool for identifying and acquiring outgassing profiles, in particular for evaluating materials for vacuum or low pressure application. 

However, the technique is limited to qualitative analysis at this point, although semi-quantitative comparative analysis is possible when one uses similar sample size. Another limitation was temperature capability. The standard DIP-MS operates from room temperature to 450°C. As a result, a high-temperature model (up to 1500°C) was developed, making it ideal for outgassing study of CMCs.

To acquire outgassing information at very high temperature (up to 2000 ºC), inert gas fusion technique has been evaluated. This technique is commonly used in the steel industry to quantify the trace elements such as O, N and H, but is sought here for high temperature outgassing analysis of CFRCs, since these elements can bind readily with matrix carbon atoms forming volatile species. 

Figure 8: Outgassing profiles of carbon composites upon heating, as acquired by DIP-MS technique. Temperature program: ramp to 500°C at 100°C/min and hold at 500°C for 3 min.
Figure 9: CO and CO2 outgassing profiles of C/C composites acquired with inert gas fusion – infrared technique in stepped temperature mode. Degree of deoxygenation in each temperature regime was quantified, corresponding to different oxygen chemistries in the composite.

Figure 9 illustrates the outgassing profiles of CO and CO2, two main oxygen-containing outgassing species from CFRCs, up to 2000°C. In the ramped temperature mode, CO and CO2 released in each temperature regime reveal various oxygen chemistries in CFRCs, and provide guideline for deoxygenation of these composites. Using NIST traceable oxygen standards, quantification of oxygen content can be readily achieved, even at μg/g level.

For determining total amount of outgassing elements O, N and H, one can take advantage of the well-established ASTM methods, incorporating inert gas fusion – infrared and thermal conductivity detection approaches, using NIST traceable standards for calibration. 

Table 2 summarizes the measured C, O, N and H content of this CFRC sample. The typical precision values for trace level H, O, and N are 4, 10, and 12% RSD (n=3-5) respectively. It is worth mentioning that with such tight RSD values, one can use the H/C ratio to evaluate the average aromatic cluster size in CFRCs.6 For this particular CFRC, the estimated average aromatic cluster size is slightly greater than 500 × 500 (row of benzene rings × column of benzene rings) per graphene sheet.

Table 2: C, H, O and N content of CFRCs
Table 2: C, H, O and N content of CFRCs*

CONCLUSION

Direct chemical analysis of CMCs is a challenging task. In this study, we demonstrated the robustness of FF-GDMS when conducting a full survey chemical analysis of CFRCs. The technique provides rapid assessment of nearly all elements in the periodic table, without the need for complex sample preparation. When operated in the pulsed mode, it also allows one to acquire surface contaminant information. In addition, we also assessed the analytical capability for outgassing behaviors of CFRCs in various temperature and pressure regimes, from room temperature up to 2000°C and ambient pressure to 10-7 torr, using multiple analytical tools, including DIP-MS, TGA and inert gas fusion – IR/TCD in stepped temperature mode.

REFERENCES

  1. Putyera, Karol, et al., “Direct Chemical Analysis of Ceramic Matrix Composites.” SAMPE Conference Proceedings. Seattle, WA, May 22-25, 2017. Society for the Advancement of Material and Process Engineering – North America, 2017, 278 – 287.
  2. Manna, S., et al., “Digestion Methods for Advanced Ceramic Materials and Subsequent Determination of Silicon and Boron by Inductively Coupled Plasma Atomic Emission Spectrometry.” J. Anal. At. Spectrom., 1997, 12, 975 – 979.
  3. Prohaska, Thomas, et al. Sector Field Mass Spectometry for Elemental and Isotopic Analysis. London : Royal Society of Chemistry, 2014.
  4. Churchill, Glyn, et al. “New μs-pulsed DC glow discharge assembly on a fast flow high power source.” J. Anal. At. Spectrom., 2011, 26, 2263.
  5. Wang, Xinwei, et al. Quantification of Trace and Ultra-trace Elements in Nuclear Grade Manufactured Graphites by Fast-Flow Glow Discharge Mass Spectrometry and by Inductively Coupled Plasma – Mass Spectrometry after Microwave – Induced Combustion Digestions. MRS Proceedings, 2010, 1215. doi: 10.1557/PROC-1215-v16-09.
  6. Xiao, Xin, et al. H/C atomic ratio as a smart linkage between pyrolytic temperatures, aromatic clusters and sorption properties of biochars derived from diverse precursory materials. Scientific Reports, 2014, 22644.

Would you like to learn more about Chemical Analysis of Ceramic Matrix Composites?

Contact us today for your chemical analysis of ceramic matrix composite needs. Please complete the form below to have an EAG expert contact you.

To enable certain features and improve your experience with us, this site stores cookies on your computer. Please click Continue to provide your authorization and permanently remove this message.

To find out more, please see our privacy policy.